This content covers the following Sub Domains:
Recommend a logging solution
Recommend a solution for routing logs
Recommend a monitoring solution
Metrics, logs, and distributed traces are commonly referred to as the three pillars of observability. Observability can be achieved by correlating data from multiple pillars and aggregating data across the entire set of resources being monitored.
Design for Azure Monitor data sources – Training | Microsoft Learn
Azure Monitor overview – Azure Monitor | Microsoft Learn
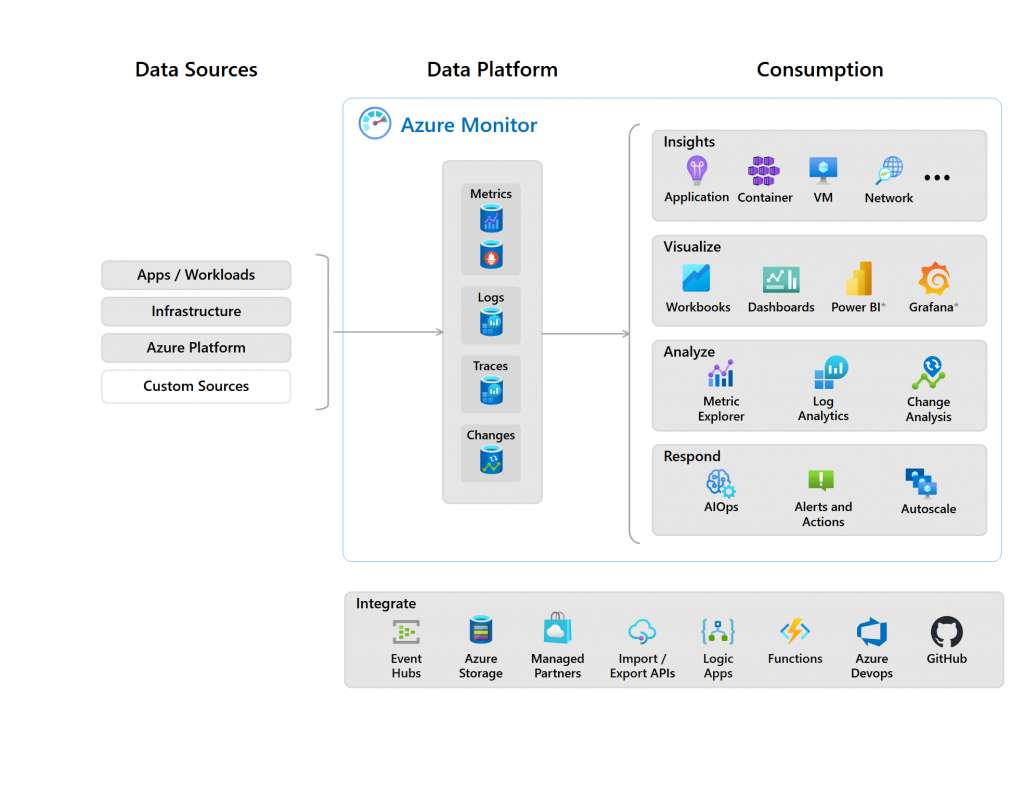
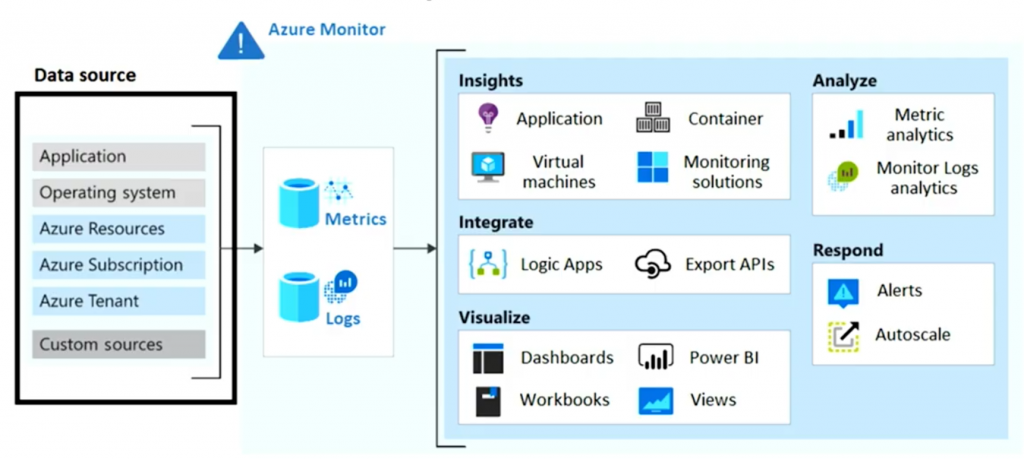
Azure Monitor is a common monitoring data platform that includes metrics, logs, traces, and changes, and it monitors various data sources. The platform offers many features that support two primary components: Logs and Metrics.
Azure Monitor Logs lets you collect and organize data from resources that you monitor. You configure what data is gathered and organized on the platform. Other features in Azure Monitor automatically store their data in Logs. You can use the stored data with your collected data to help monitor the performance of your environment.
You can collect logs, manage log data and costs, and consume different types of data in one Log Analytics workspace, the primary Azure Monitor Logs resource.
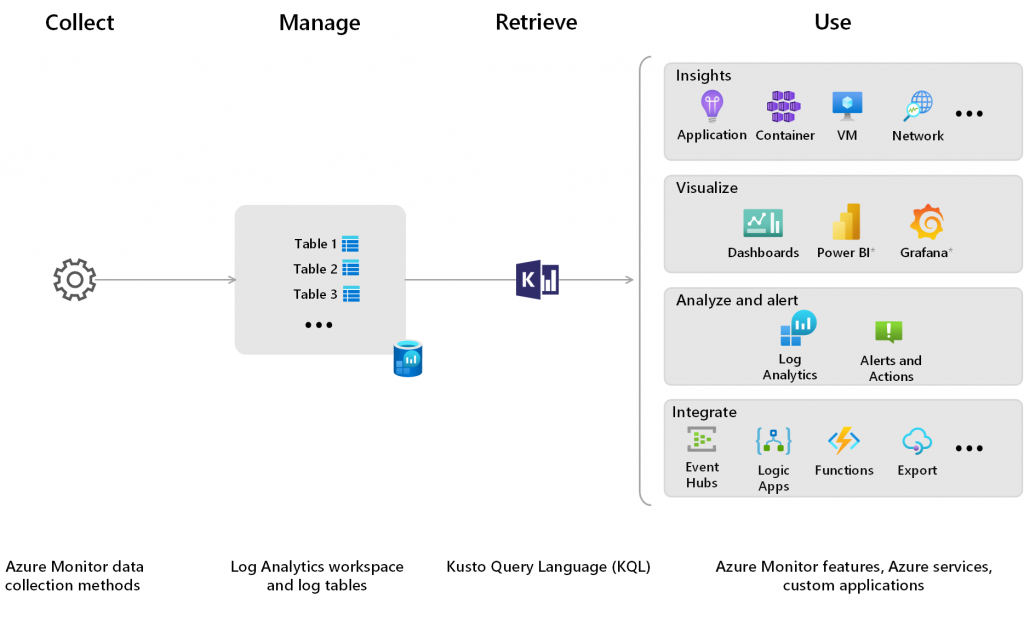
Workflow:
1. Collect any data by using Azure Monitor data collection methods.
2. Manage and optimize log data and costs by configuring your Log Analytics workspace and log tables
3. Retrieve data in near-real time by using Kusto Query language (KQL)
4. Use data flexibly for a range of use cases, including data analysis, troubleshooting, alerting, dashboards and reports, custom applications, and other Azure or non-Azure services
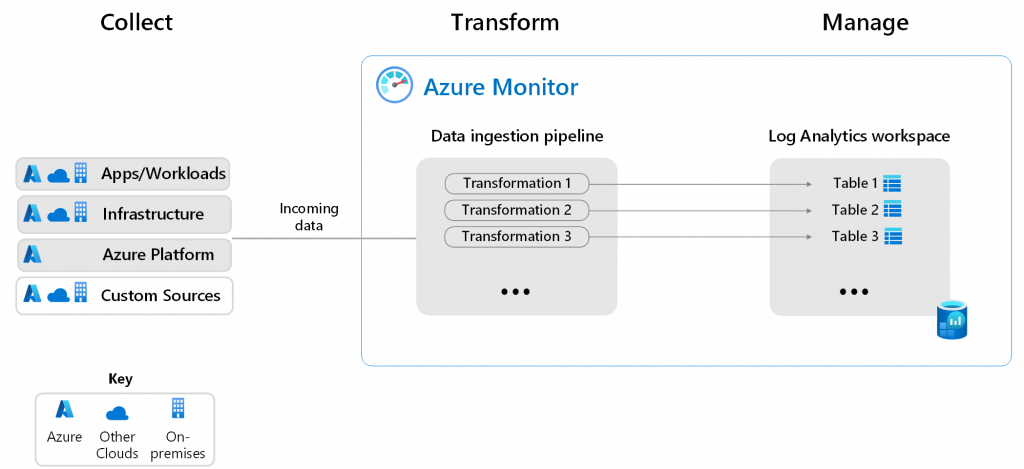
Data Collection:
Azure Monitor data sources and data collection methods
Data collection transformations in Azure Monitor.
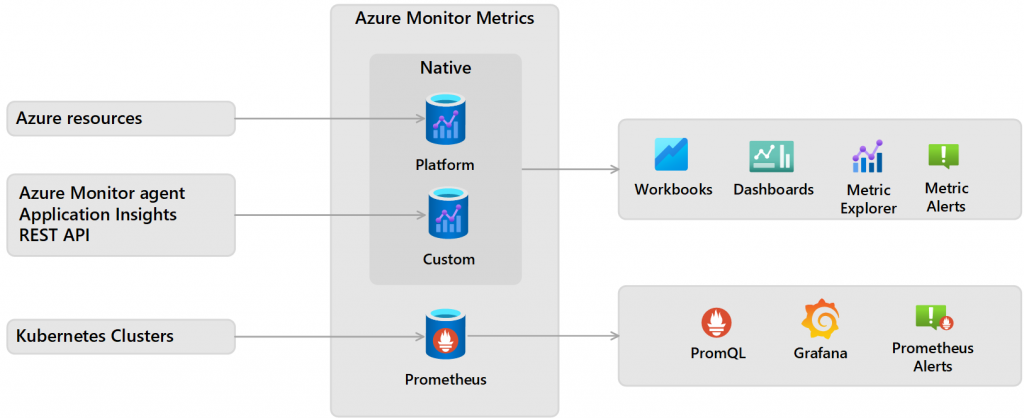
Azure Monitor Metrics is a feature of Azure Monitor that collects numeric data from monitored resources into a time-series database. Metrics are numerical values that are collected at regular intervals and describe some aspect of a system at a particular time.
Types of metrics and destinations:
- Native – Can be Platform or Custom.
- Platform don’t need configuration and don’t have cost, collected automatically from Azure Resources
- Custom needs configuration – like Applications and Agents running in VMs
- Prometheus – from Kubernetes Clusters, including AKS. Sent to PromQL, Grafana, etc…
Platform and custom metrics are stored for 93 days with the following exceptions:
– Classic guest OS metrics: at least 14 days, although no expiration date is defined
– Guest OS metrics collected by the Log Analytics agent: 31 days and can be extended up to 2 years
– Application Insights log-based metrics:31 days to 2 years
Moving or renaming an Azure Resource may result in a loss of metric history for that resource.
Wider view:
Understand how it pulls together data from all over:
Apps
Guest Operating Systems
Azure resources
Subscriptions
Entra ID
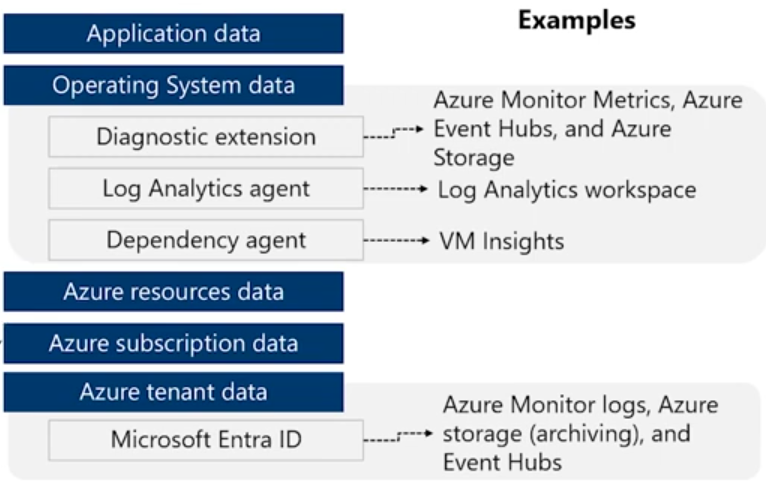
Identify data sources and access method
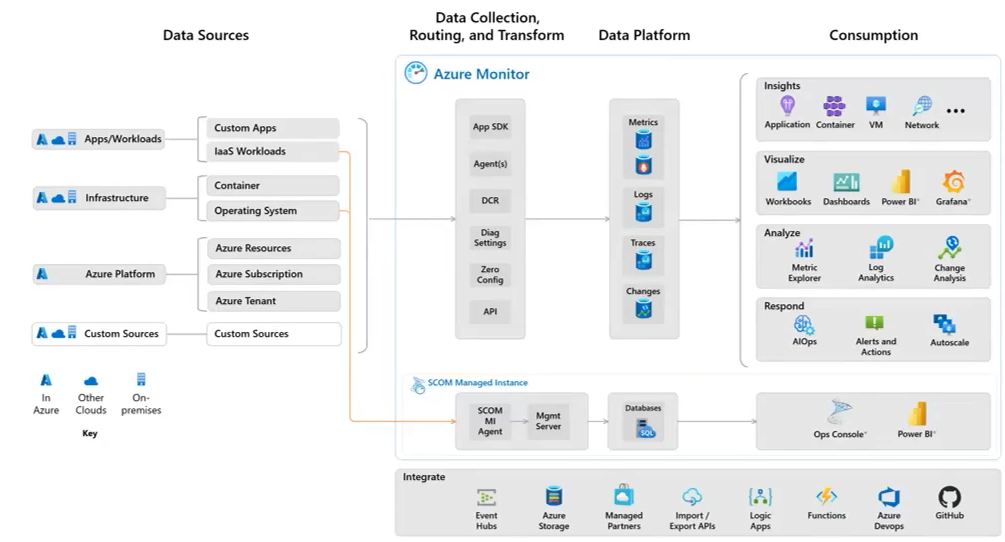
Azure Monitor collects data automatically from a range of components:
· Data tiers go from Azure applications (highest tier) to Azure platform components
(lowest tier)
· The method of accessing data from each tier varies – for example, installing an agent
· Each data tier can stream to different external systems
· Prioritize and be deliberate on what data sources you need
· Windows events
· Linux syslog
· Client performance data
· Processes and dependencies (VM Insights)
· Application text logs
. IIS logs
· SNMP traps
· Management pack data (SCOM)
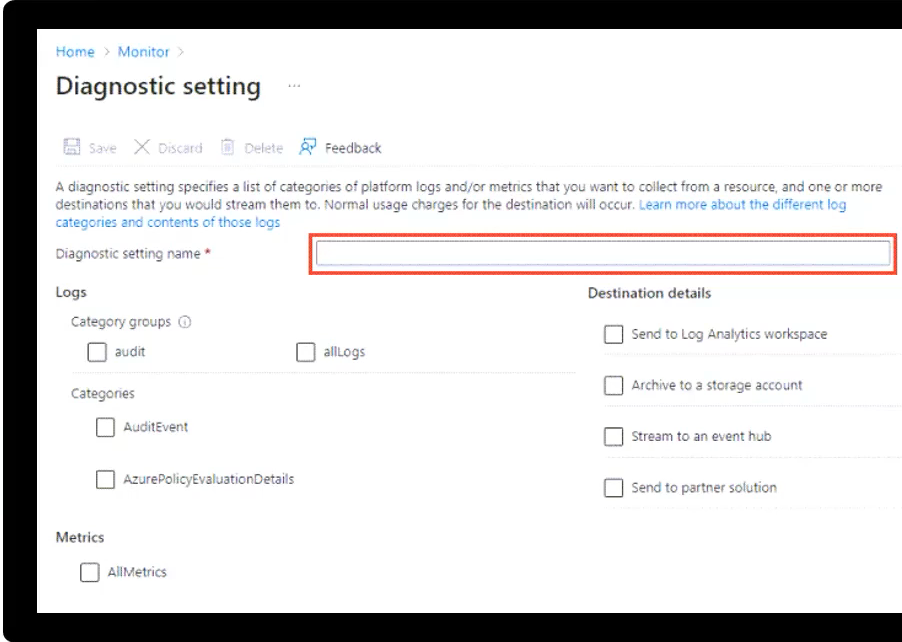
Know how it collects metrics and logs, stores them in places like log analytics, and then uses Diagnostic Settings to route that data to different destinations like event hubs or workspaces, archives to Storage Accounts for longer term storage or sends to a partner solution, like Splunk.
You can set up to five of these per resource so be ready to configure and explain them.
This is a core monitoring and logging skill set that you’ll need to know for the exam.
Verify:
- Log sources
- Log levels
Analyze log treatment:
Where the logs need to be directed after they are generated and how to direct them to where they need to be.
There are different possible destinations for each kind of log.
Design for Azure Monitor Logs (Log Analytics) workspaces.
What is Log Analytics?
Log Analytics is a service in that helps you collect and analyze data.
· Azure Monitor stores log data in the workspace
· Data in a workspace is organized into tables with properties you can query
A Log Analytics workspace provides:
· A geographic location for data storage.
· Data isolation by granting different users access rights following one of our recommended design strategies.
· Scope for configuration of settings like pricing tier, retention, and data capping.
Below are the destination of different types of logs for the internal Log Analytics tables:
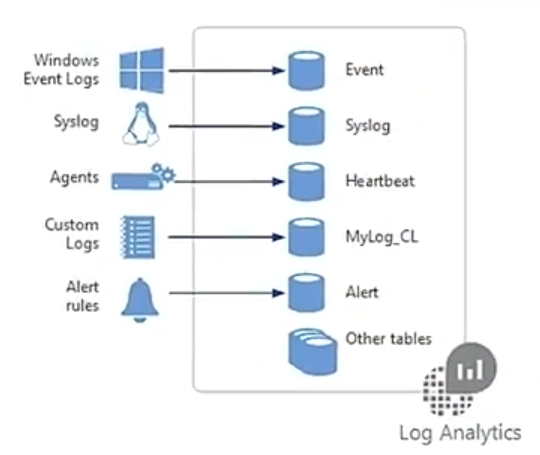
We can run queries in these tables and get results using KQL
Considerations for workspace access control
Access can be Centralized, Decentralized or Hybrid:
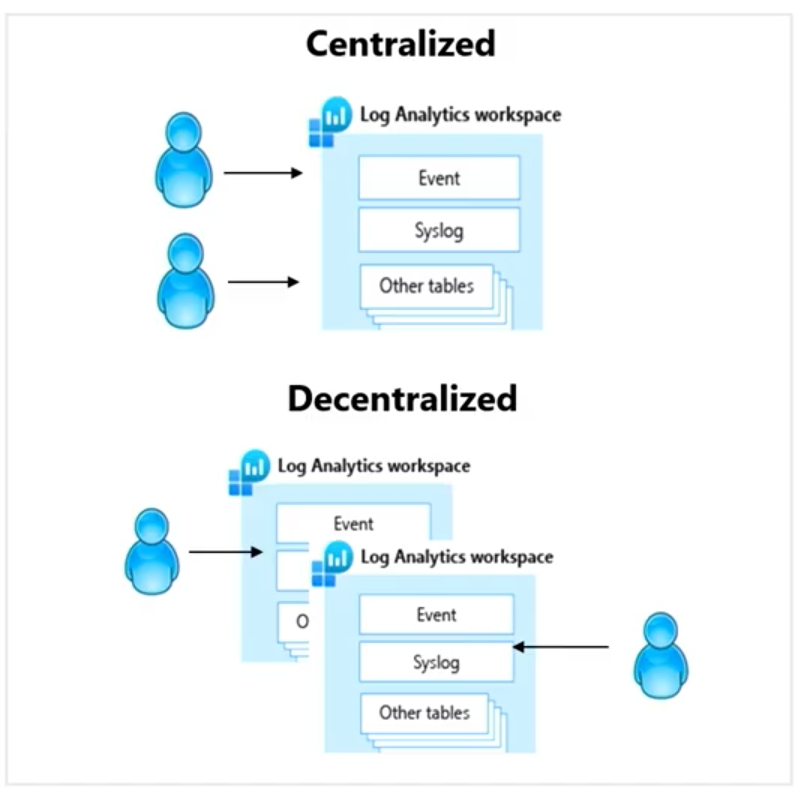
Centralized: All logs are stored in a central workspace and administered by a single team, with Azure Monitor providing differentiated access per-team.
Decentralized: Each team has their own workspace created in a resource group they own and manage, and log data is segregated per resource.
Hybrid: Security audit compliance requirements further complicate this scenario because many organizations implement both deployment models in parallel.
Considerations:
Centralized can bring latency, but is easier to maintain securely
Decentralized harder to manage, but can be more flexible
Hybrid is the most popular: centralize common logs, like security and auditing, and decentralize for application specific logs for each app team
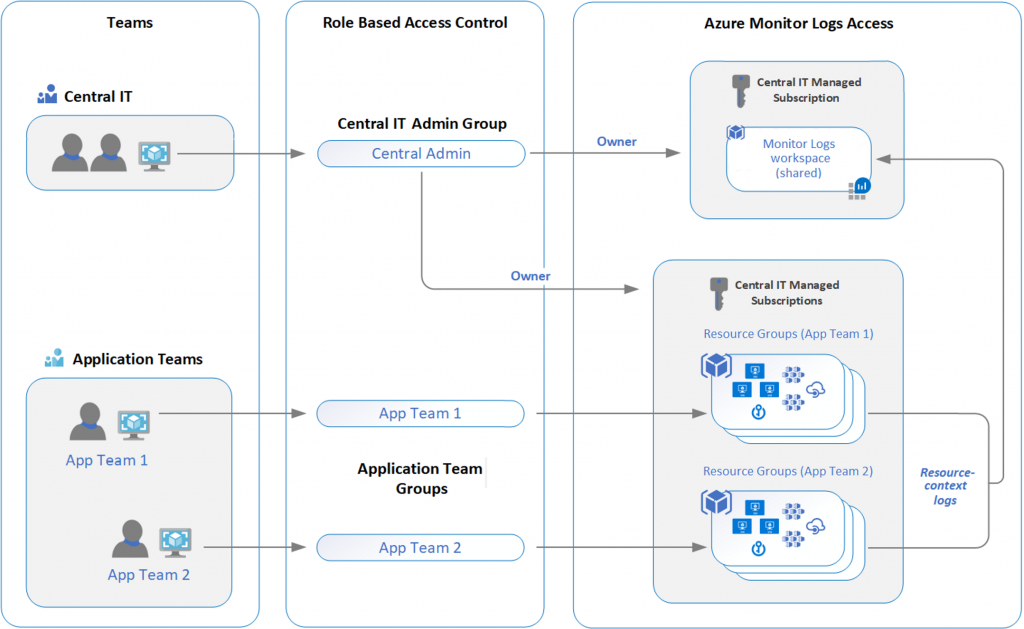
Considerations for access mode
The access mode is how a user accesses the workspace and what data they can access.
| Issue | Workspace-context | Resource-context |
| How does the access mode work? |
. You can view all logs in the workspace you have permission to. . Queries in this mode are scoped to all data in all tables in the workspace. . This is the access mode used when logs are accessed with the workspace as the scope. |
. When you access the workspace for a particular resource, resource group, or subscription. . You can view logs for only resources in all tables that you have access to. . Queries in this mode are scoped to only data associated with that resource. |
| Who is each model intended for? | Central administration | Application teams |
| What does a user require to view logs? | Permissions to the workspace | Read access to the resource |
| What is the scope of permissions? | Workspace | Azure resource |
Workspaces are hosted on physical clusters. By default, the system creates and manages these clusters. If your system ingests more than 500 GB of data per day, you create your own dedicated clusters for your workspaces to support greater control and higher ingestion rate.
Design for Azure Workbooks and Azure Insights.
Workbooks provide a flexible canvas for data analysis and the creation of rich visual reports within the Azure portal, combine data from disparate sources within a single report
Tap into multiple data sources and combine them into unified interactive experiences
Provide insights into the availability, performance, usage, and health of resources
Enable rich data and insights through composite views and joins
Workbooks are currently compatible with the following data sources:
- Logs (Analytics Tables, Application Insights)
- Logs (Basic, Auxiliary Tables)
- Metrics
- Azure Resource Graph
- Azure Resource Manager
- Azure Data Explorer
- JSON
- Merge
- Custom endpoint
- Workload health
- Azure resource health
- Azure RBAC
- Change Analysis (classic)
- Prometheus
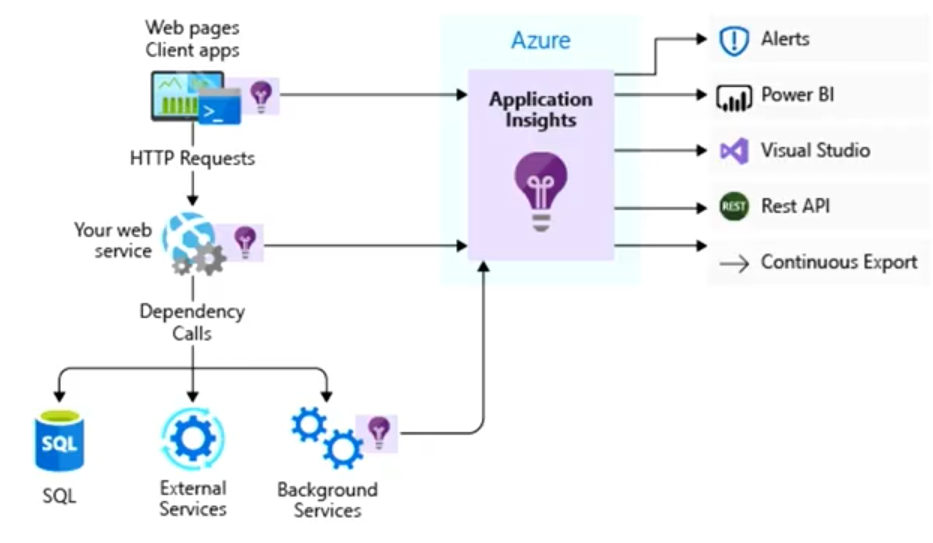
Design for Azure Insights
It’s critical to monitor your systems closely to identify any performance problems or attacks before they can affect users. Designing insights as a part of your overall architecture will help identify performance issues.
Use Application Insights to:
- Analyze and address issues and problems that affect your application’s health and performance.
- Improve your application’s development lifecycle.
- Measure your user experience and analyze users’ behavior.
Use Azure Monitor VM insights to:
- View the health and performance of your VMs.
- Monitor your VMs at-scale across multiple subscriptions and resource groups.
- Want a topology view that shows the processes, and network connection details of your VMs and scale sets.
Use Azure Monitor Container Insights to:
- View the health and performance of your Kubernetes workloads at-scale across multiple subscriptions and resource groups.
- Want visibility into memory and processor performance metrics from controllers, nodes, and containers.
- Want view and store container logs for real time and historical analysis.
Types of Insights X Uses
| Application Insights | Monitor your live web application on any platform by using this extensible Application Performance Management (APM) service that’s available in Azure Monitor. |
| Container insights | Check the performance of container workloads deployed to either Azure Container Instances or managed Kubernetes clusters hosted on Azure Kubernetes Service (AKS). |
| Networks insights | Obtain comprehensive information on the health and metrics for all your network resources. Use the advanced search capability to identify resource dependencies. Searching by your website name to locate resources that host your website. |
| Resource group insights | Triage and diagnose any problems your individual resources encounter, while offering context as to the health and performance of the resource group as a whole. |
| Virtual machine insights | Monitor your Azure Virtual Machines, Virtual Machine Scale Sets, and other virtual machines. Analyze the performance and health of your Windows and Linux Virtual Machines, and monitor their processes and dependencies on other resources and external processes. |
| Azure Cache for Redis insights | Review a unified, interactive report of overall performance, failures, capacity, and operational health. |
| Azure Cosmos DB insights | Get information on the overall performance, failures, capacity, and operational health of all your Azure Cosmos DB resources in a unified interactive experience. |
| Azure Key Vault insights | Monitor your key vaults by using a unified report of your Key Vault requests, performance, failures, and latency. |
| Azure Storage insights | Do comprehensive monitoring of your Storage accounts via a unified report of your Storage performance, capacity, and availability. |
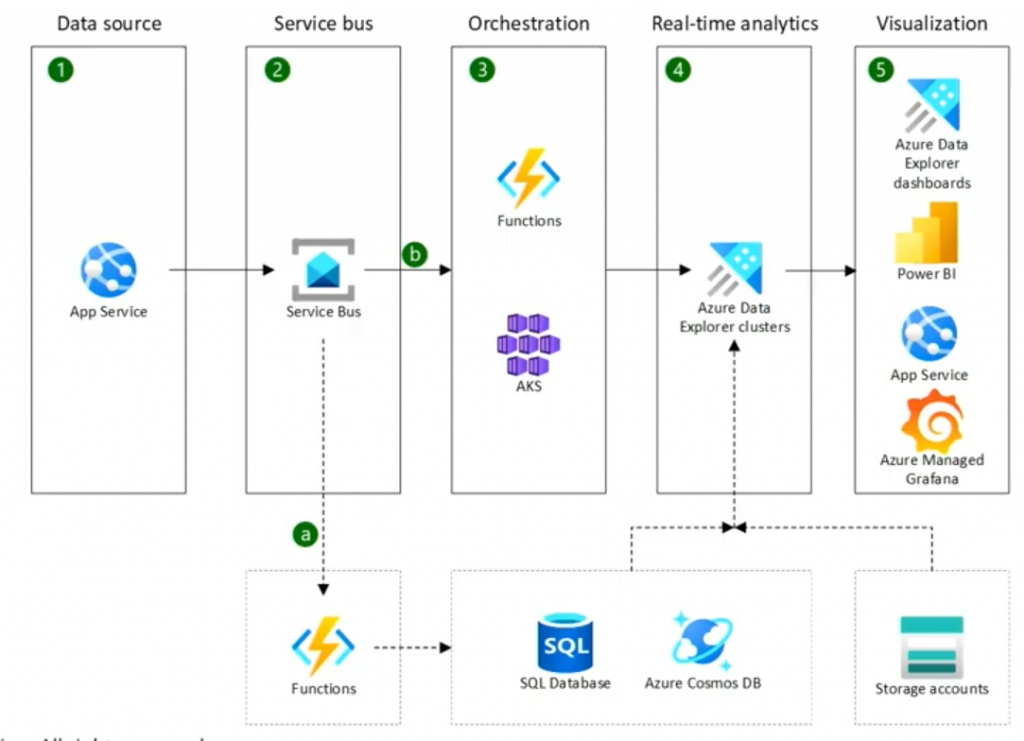
Design for Azure Data Explorer.
Azure Data Explorer is a platform for big data that helps you analyze high volumes of data in near real time. Azure Data Explorer comes equipped with features to help you configure an end-to-end solution for ingesting and managing your data, running queries, and generating visualizations.
Fast and highly scalable data exploration
Handle multiple data streams, so you can collect, store, and analyze your data from all resources
Analyze large volumes of diverse data from any data source
Diagnostics, monitoring, reporting, machine learning, and other analytics tasks
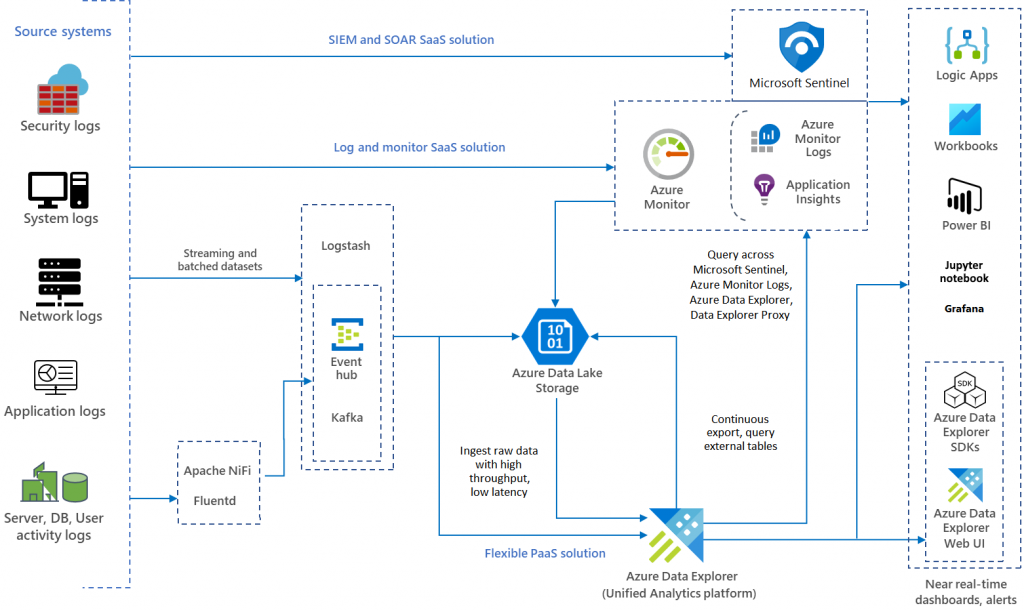
SIEM – Security Information & Event Management – Informational only
SOAR Security Orchestration, Automation & Response – Takes automated action
Additional Links:
Design a solution to log and monitor Azure resources – AZ-305
https://docs.microsoft.com/en-us/learn/modules/design-solution-to-log-monitor-azure-resources/5-design-for-azure-data-explorer
https://docs.microsoft.com/en-us/learn/modules/configure-web-app-settings/5-enable-diagnostic-logging